

- When we all watch cricket matches we often use the words that statistics are being compared to batsmen with another one.
- The word is very common everywhere but do we really what does this means. Let’s just find out.
- In Statistics, we are going to learn about the various formulas using which we can find out the three measures of central tendency that is Mean, Mode and Median.
- Here we will learn about grouped data and hence will find the respective Mean, Mode and Median.
- Statistics is actually the branch of mathematics which deals collection, analysis, organization, and presentation of data.
- As we all know that the diversity of data is so much that we cannot categorize the data properly and hence the role of statistics in our day to day life is of very much importance.
There is an important relationship between mean, mode and median which says:
3 Median = Mode + 2 Mean
This means that median divides mode and mean in the ratio of 1:2.
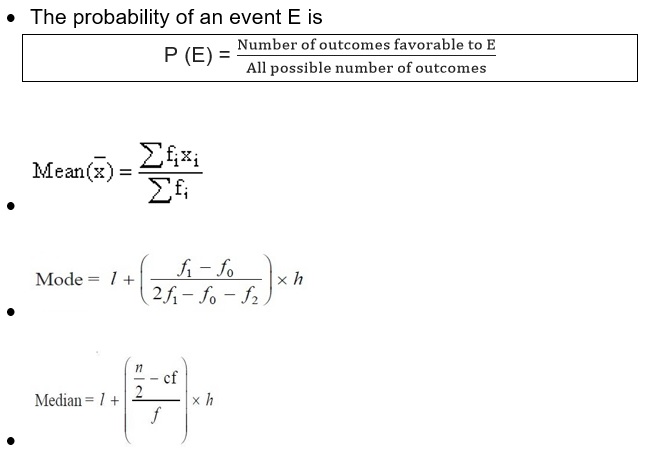
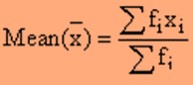
Mean
For any observation, the mean is defined as the sum of the values of all the observations divided by the total number of observations.
- Mean is also termed as an average of the data.
- There are three types of means
1) Arithmetic Mean 2) Geometric Mean 3) Harmonic Mean
We can calculate the mean of any data from the following three formulae:
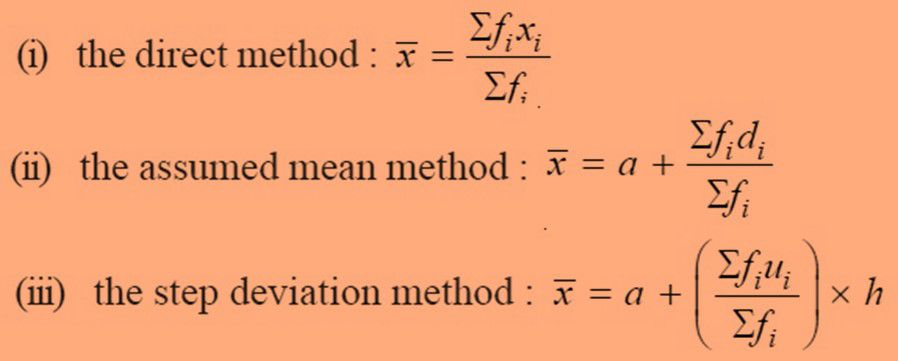
Here,
fi is the frequency of the ith observation where i is a natural number.
xi is the ith observation where i is a natural number.
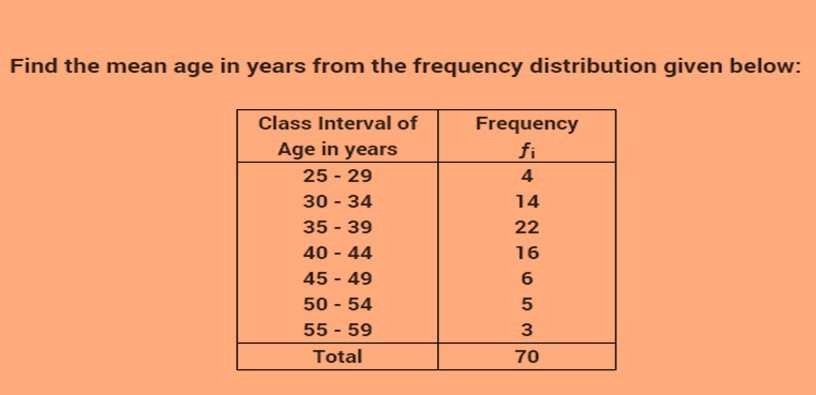
Example 1: Find the mean of the following data.

Solution: Here we can find the mean by using direct method:
x1 = 27, x2= 32, x3=37, x4=42, x5=47, x6=52, x7=57
= (4 x 27) + (14 x 32) + (22 x 37) + (42 x 16) +
(47 x 6) + (52 x 5) + (57 x 3)
= 108 + 448 + 814 + 672 + 282 + 260 + 171 = 2755
Therefore mean will be = 2755 / 70 = 39.35
Mode
The mode of a set of data values is the value that appears most often. In simple words mode is that value in the data that appears most number of time.
For example, the mode of the sample [1, 3, 8, 8, 8, 8, 5, 4, 12, 12, 17 ] is 8.
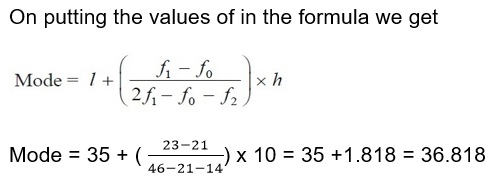
The formula to calculate mode is:
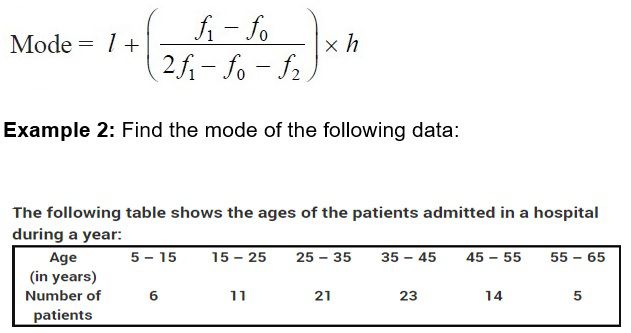
Solution: Here we can identify that
l = lower value of modal class = 35
Class size = h = 10
Frequency of modal class (f1) = 23
Frequency (f0) of class preceding to modal class = 21
Frequency (f2) of class succeeding to modal class = 1
Median
The median is a measure of central tendency which gives the value of the middle-most observation in the data. It simply means the measure of the central value of the data.
For example, in the data set {1, 3, 3, 4, 7, 8, 9}, the median is 4.
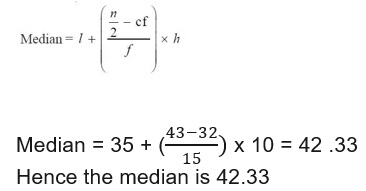
The formula for calculating the median is:
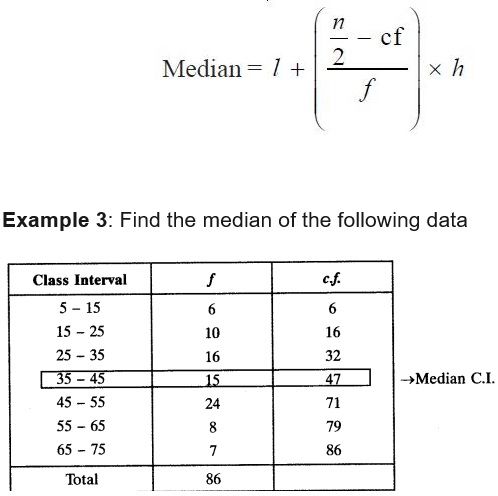
Solution: Here the value of N and hence N/2 = 43.
On putting the values in the formula we get
Probability
- Probability is the measure of the likelihood that an event will occur. Basically, it’s just that if an event is going to happen or not.
- For example, when we toss a coin there is a probability that the outcome maybe head or tails and nothing else.
- The probability lies between 0 and 1 where 0 indicates the impossibility and 1 indicates certainty.
- The higher will be the probability the more likely the event will occur.
- The event has to be fair for the determination of probability in an unbiased manner.
Theoretical Probability
It is also called as the classical probability.
It is the probability of the favorable outcomes to the total number of outcomes.

- P(E) + P(not E) = 1
- And 0≤P(E) ≤1
The event, not E is called as the complement of event E and hence events E and not E are complimentary.
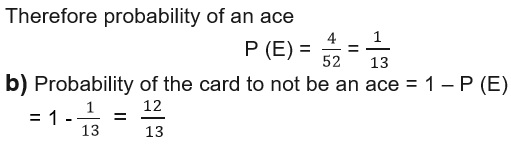
Example 4: One card is drawn from a well-shuffled deck of 52 cards. Calculate the probability that the card will
- a) be an ace
- b) not be an ace
Solution: a) There are 4 aces in a deck. Let E be the event ‘the card is an ace’. The number of outcomes favorable to E = 4
The number of possible outcomes = 52
Practice Questions
Q1) A box contains 4 blue, 2 whites and 4 red marbles. If a marble. If a marble is drawn at random from the box, what is the probability that it will be
- a) white? b) blue? c) red?
Q2) If P(E) = 0.05, what is the probability of ‘not E’?
Q3) Find the mean of the following data. If the median of the data is 45.32 then find the mode of the data.
Q4) State True or False:
- a) 3 Median = Mode + 2Mean
- b) 1≤P(E)≤0
- c) P( not E) = 1 + P(E)
Recap
- The probability of an event E is P(E) then 0 ≤ P(E) ≤1.
- The probability of an impossible event is 0 whereas probability of a certain event is 1.