- In our earlier classes, we all have studied about the equations in one variable which means that we have to find out the value of the only variable.
- Here we are going to extend our decision to the linear equations in two variables and we will learn how to solve them.
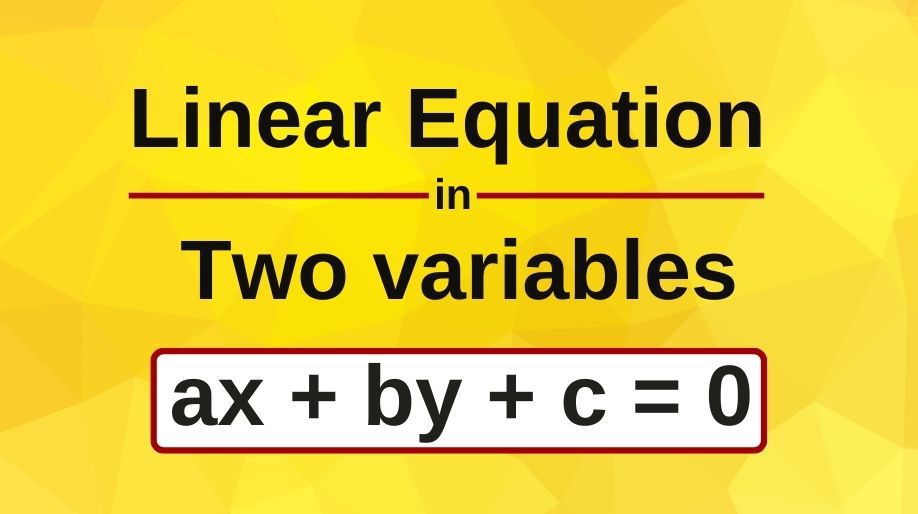
- An equation with two variables in the form of ax+by+c=0 is called as a linear equation in two variables.
- Here a and b are the coefficients of x and y respectively and c is a constant.
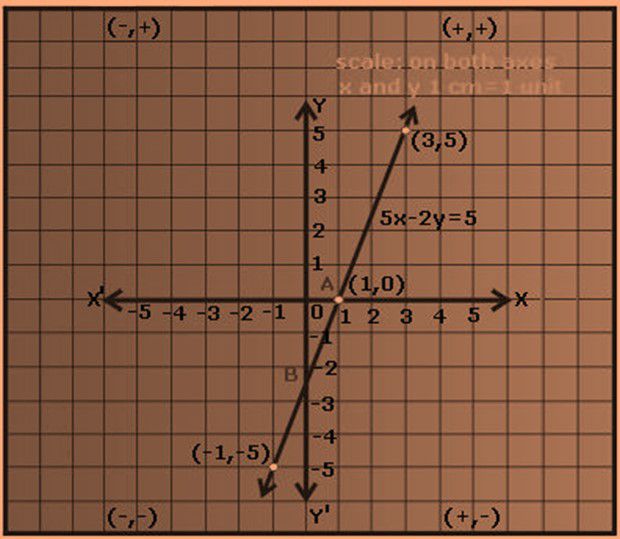
- A linear equation in two variables represents a straight line.
- The figure below shows the example of a linear equation in two variables and its graphical representation.

Solution of a Linear Equation in Two Variables
- For a linear equation in two variables, for every unique value of x there will be a unique value of y and vice versa.
- But here unlike linear equation in one variable, we can have plenty of solutions as the values of the variables x and y can be changed.
- Here before we head towards finding the solution of the linear equations, we should remember some of the basic points:
- The solution of a linear equation is not affected when:
(i) The same number is added to (or subtracted from) both the sides of the equation.
(ii) You multiply or divide both the sides of the equation by the same non-zero number.
Example 1: Find 3 solutions of the linear equation 2x-y=6.
Solution: To find the solution, let us manipulate the value of x to obtain the value of y.
On putting the value of x=0, we get -y=6 which means y=-6.
On putting the value of x=1, we get 2-y=6 which means y=-4.
On putting the value of x=2, we get 4-y=6 which means y=-2.
Hence the solution set of the linear equation is (0,-6), (1,-4), (2,-2)
Graph of a Linear Equation in Two Variables
- In mathematics, each and every equation has a graphical representation and the solutions of these equations are shown in the graphs itself.
- Hence here we are going to learn about the concepts of the graphs of a linear equation.
- As we have seen in the figure above we all can predict and imagine the graph of any linear equation.
- The process of making the graph of a linear equation is just a forward approach of marking points on the Cartesian plane and then joining these points to obtain the straight line which is the representation of the linear equation. Isn’t it interesting and fun?
- The process of graph making involves the following steps:
- a) Find out at least 4 points which are the solution of the linear equation.
- b) Trace these points on the Cartesian plane.
- c) Join these points to obtain the straight line which will be the representation of the linear equation.
Let us learn these steps from an example.
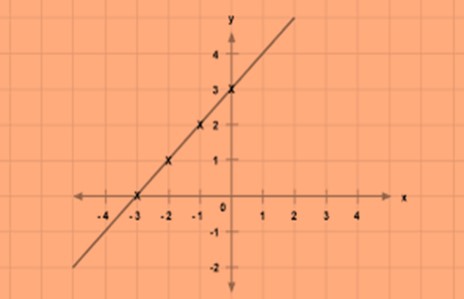
Example 2: Represent the linear equation x-y=3 graphically.
Solution: we will try to find out at least 4 solutions of the above linear equation.
On putting x=0 we get y=-3.
On putting x=1, we get y=-2.
On putting x=2, we get y=-1.
On putting x=3, we get y=0.
On tracing out these points in the Cartesian plane and joining them we get our linear equation graphically.

Equations of Lines Parallel to X and Y axis
- If any line is parallel to X-axis then the y coordinate (ordinate) of all the points on the line is constant that is it will be same throughout the equation of the line.
- If any line is parallel to Y-axis, then the x coordinate (abscissa) of all the points on the line will be constant that is it will be same throughout the equation of the line.
Practice Questions
Q1) Give the geometric representation of the line 2x+3=0.
Q2) Yamini and Fatima, two students of Class IX of a school, together contributed Rs 100 towards the Prime Minister’s Relief Fund to help the earthquake victims. Write a linear equation which satisfies this data. (You may take their contributions as Rs x and Rs y.) Draw the graph of the same.
Q3) Represent the equation 4x-3y=9 graphically on the Cartesian plane.
Q4) Find the value of k, if x = 3, y = 2 is a solution of the equation 3x - 2y = k.
Recap
- An equation of the form ax + by + c = 0, where a, b and c are real numbers, such that a and b are not both zero, is called a linear equation in two variables.
- A linear equation in two variables has infinitely many solutions.
- The graph of every linear equation in two variables is a straight line.
- Every point on the graph of a linear equation in two variables is a solution of the linear equation. Moreover, every solution of the linear equation is a point on the graph of the linear equation.
- An equation of the type y = mx represents a line passing through the origin.
- The graph of x = a is a straight line parallel to the y-axis.
- The graph of y = a is a straight line parallel to the x-axis.
- x = 0 is the equation of the y-axis and y = 0 is the equation of the x-axis.
- For a linear equation in two variables, for every unique value of x, there will be a unique value of y and vice versa.


