Symmetry
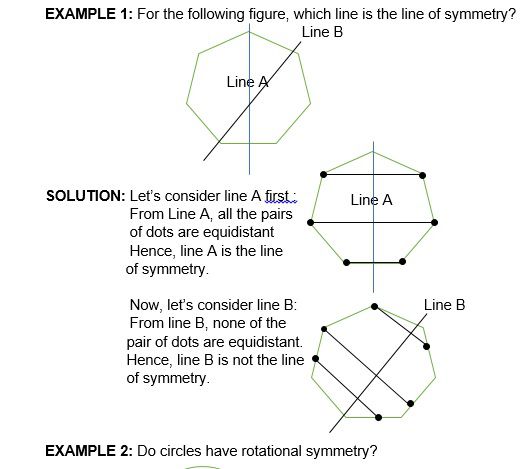
- Symmetry is when one shape becomes exactly like another if you flip, slide or turn it.

- The perpendicular line separating the left and right side in the above diagram is known as axis of symmetry.
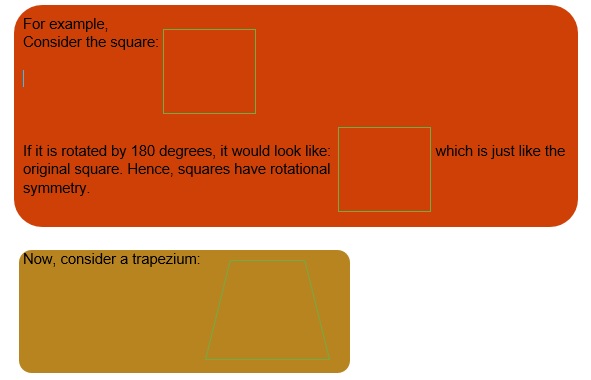
Rotational Symmetry: If a figure is unchanged after a rotation (of an angle less than 360 degrees) around its centre, then that figure has rotational symmetry.


SOLUTION: A circle will always fit into its original outline, regardless of how many times it is rotated. Hence, a circle has rotational symmetry and its order of rotational
symmetry is infinite.
Data Handling
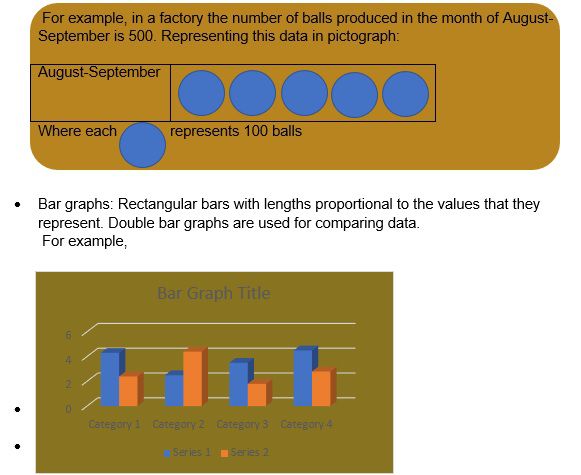
- Data handling means gathering and recording information and then presenting them in a way that is meaningful. Data handling can be done in four ways:
i) Tally Charts. ii) Pictographs.
iii) Bar graphs. iv) Pie charts.
- Tally Charts: Tally Chart is a quick way of keeping track of data in groups of five. One vertical line each represents the first number; the fifth number is represented by a horizontal line across the previous four.
For example,
I = 1
IIII = 4
IIII = 5
IIII III = 8
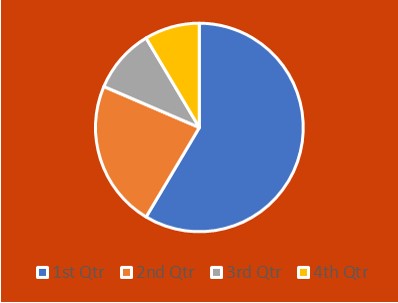
- Pie Chart: Pie Chart shows the percentage of distribution of items. Each non-intersecting sector is proportional to the magnitude of data.
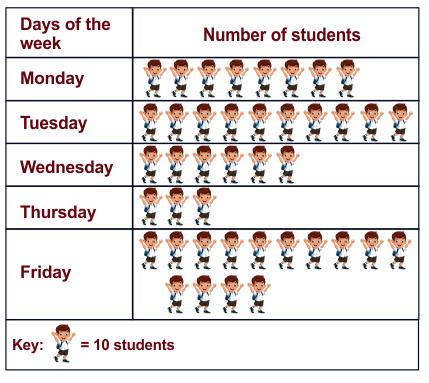
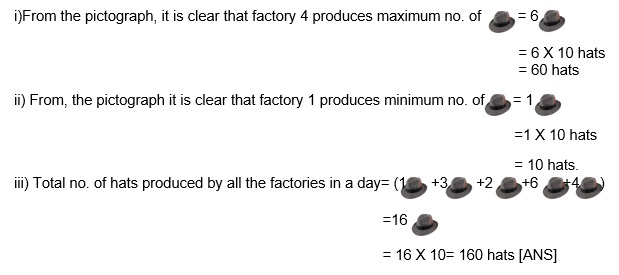
EXAMPLE 1: The following pictograph shows the number of hats produced in 5 different factories in a day.

Find the following:
i) The factory which manufactures the maximum number of hats.
ii)The factory which manufactures the minimum number of hats.
iii) Total number of hats manufactured by all the factories in a day.
SOLUTION:
EXAMPLE 2: Read the bar graph given below and answer the following.
How many families have 5 members?
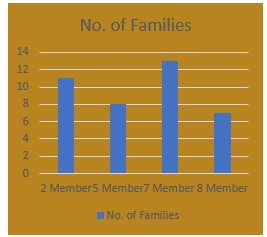
SOLUTION: 8 families have 5 members.
Practice these questions
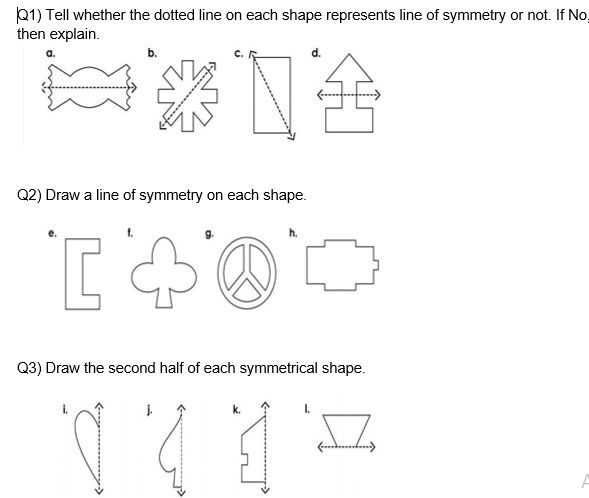
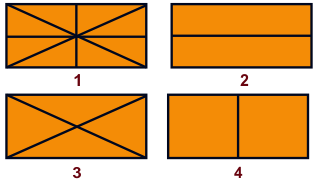
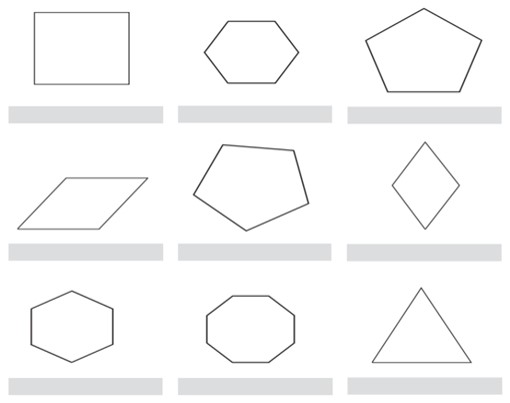
Q4) How many lines of symmetry do these figures have?
Q5) 90 children were asked about their favourite cartoon. Look at their replies below and make a pie chart according to it:
Cartoon No. of student
Pokémon 30
Batman 20
The Flintstones 10
Looney Tunes 5
SpongeBob SquarePants 25
Q6) Complete the Tally Chart.
Favourite game of students in class V.
|
Games |
Tally Marks |
Number |
|
Football |
IIII IIII IIII |
|
|
Volley Ball |
IIII IIII I |
|
|
Tennis |
IIII II |
|
|
Cricket |
IIII IIII I |
- Which is the most popular game? b) Which is the least popular game? c) Which two games are equally popular? d) How many children like football more than cricket?
e) How many children are there in class V.
Recap
- Symmetry is when one shape becomes exactly like another if you flip, slide, or turn it.
- The imaginary line separating two mirror images is called line of symmetry. It is also known as axis of symmetry.
- If a figure is unchanged after a rotation (of an angle less than 360 degrees) about its centre, then that figure has rotational symmetry.
- Data handling means gathering and recording information and then presenting them in a way that is meaningful.
- Data handling can be done in four ways:
i) Tally Charts. ii) Pictographs.
iii) Bar graphs. iv) Pie charts.
Double bar graphs are used for comparing data.


