
We all come across such a huge amount of data whether the marks, attendance, numbers and a lot more.
We all need to arrange these data according to our need so that in future the accessibility of the data is easy. Here we are going to learn about the handling of the data and how it has to be done.
- A data is a collection of numbers gathered to give some information.
- Data is recorded according to the requirement and then it is stored either in a tabular form or some graphical or pictorial so that in future it can be accessed and used.
- The most common and easiest way to represent and store a data is through tally marks.
- Gathering and recording information and then presenting it in a way that it is meaningful to others is called as Data Handling.
For example, when we watch a cricket match the runs scored by the batsmen, by the team, the wickets were taken by the bowler, the run rate etc are all recorded. These all are data and how the recording of data and presenting them in front of the viewers such that they are able to understand it is called as Data Handling.
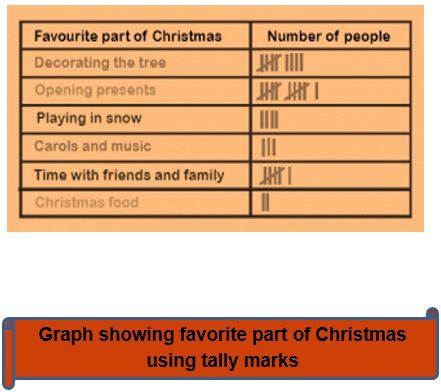
Tally Chart
- The most commonly used method of data handling is the tally graph method.
- In this method, the data is represented using the straight horizontal sticks in a group of or less, where each stick represents a data.
We all can see in the following tally chart that which is the favorite part of Christmas of how many people and here each of the tally marks shows a single person who likes that part of Christmas.
Pictograph
- A pictograph represents data through pictures of objects. It helps answer the questions on the data at a glance.
- Pictographs are often used by dailies and magazines to attract reader’s attention.
- In simple words, in the pictograph, we use pictures to represent the data instead of tally marks.
Example 1: The following pictograph represents the data of the number of books sold in a week at a library. After analyzing the graph answer the following questions.
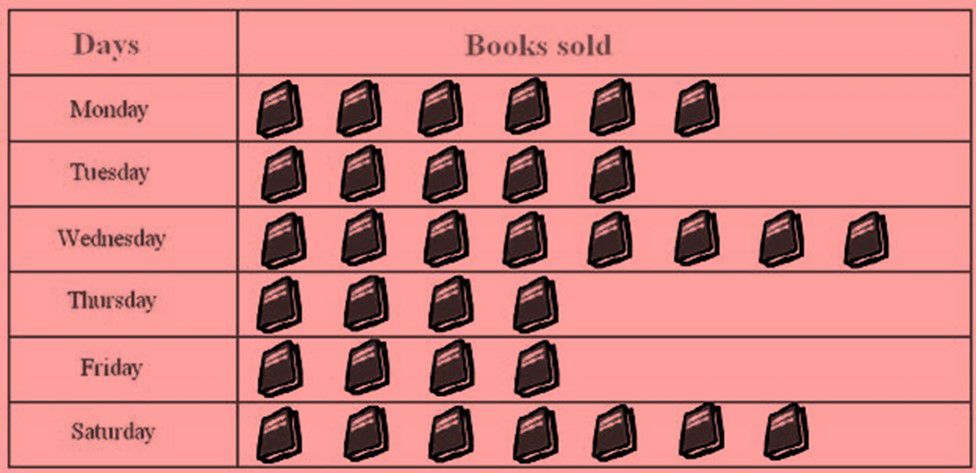
- Find the number of books sold on Saturday.
- Find the day on which the minimum and a maximum number of books are sold.
Solution: a) The number of books sold on Saturday was 7.
- b) The minimum number of books sold was on Thursday and Friday and maximum number was sold on Wednesday.
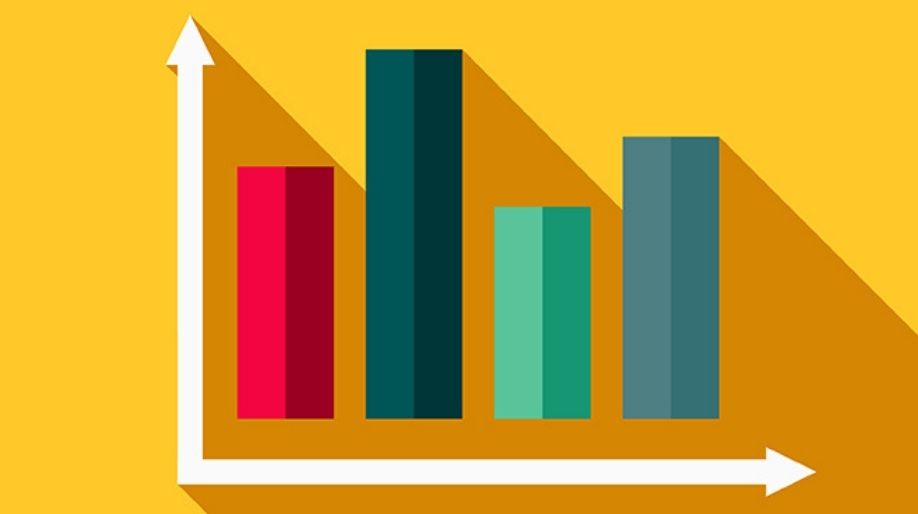
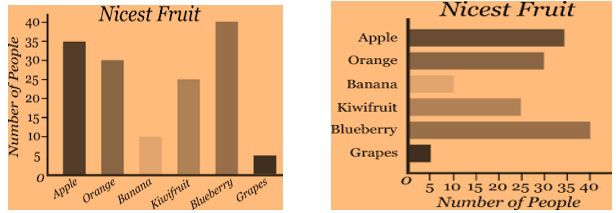
Bar Graph
- Since representing data in the form of pictographs is really difficult and consuming hence we require a better way to represent the data in a more effective manner.
- When bars of uniform width can be drawn horizontally or vertically with equal spacing between in such a manner that the length of each bar represents the given quantity.
- Such method of representing data is called a bar diagram or a bar graph.
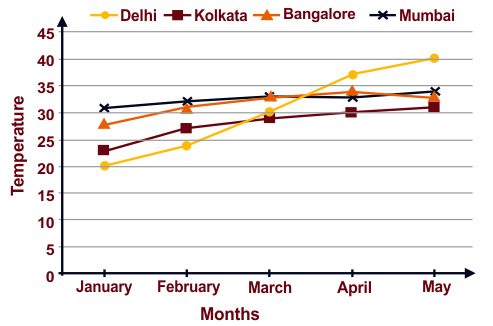
Example 2: The following graphs shows the numbers of students whose birthdays fall on the month of January to February. Study the graph properly and answer the following question:
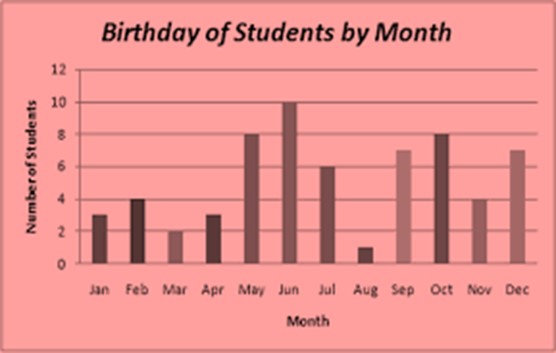
- Find the number of students who have their birthday in the month of May and August.
- Find the month on which the maximum number of students have their birthdays.
- Find the months on which the same number of students have their birthdays.
Solution: After analyzing the graph
a) 8 students have their birthdays on May and only 1 student has his birthday in August.
b) On the month of June 10 students have their birthdays.
c) On the month February and November 4 students have their birthdays.
Practice Questions
Q1) Analyze the graph and answer the following questions:
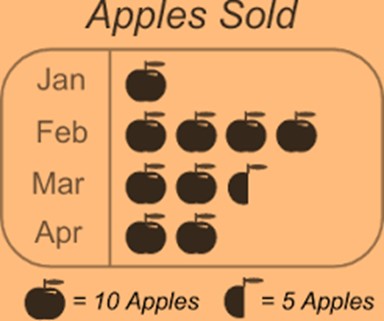
How many apples are sold in the month of February?
b) In which month maximum and in which the minimum number of apples were sold?
Q2) Analyze the graph and answer the following questions:
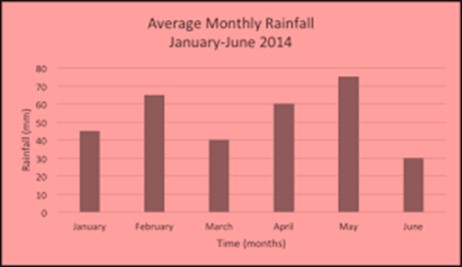
a) In which month maximum rainfall took place?
b) In which month minimum rainfall took place?
Recap
- A data is a collection of numbers gathered to give some information.
- The most common and easiest way to represent and store a data is through tally marks.
- A pictograph represents data through pictures of objects. It helps answer the questions on the data at a glance.
- The graphical representation of data in vertical as well as horizontal bars is known as a bar graph.