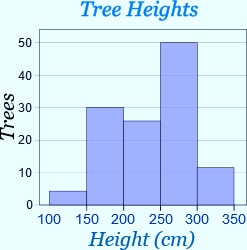
A graphical display where the data is grouped into ranges (such as "100 to 149", "150 to 199", etc), and then plotted as bars. Similar to a Bar Graph, but in a Histogram each bar is for a range of data.

A graphical display where the data is grouped into ranges (such as "100 to 149", "150 to 199", etc), and then plotted as bars. Similar to a Bar Graph, but in a Histogram each bar is for a range of data.

Yearlong program for Olympiads preparation & to build necessary skills for future.
Explore More
Time to mark your calendar with the upcoming Olympiads exam schedule.
Explore More
Take your Olympiad preparation to next-level by taking LIVE Classes.
Explore More
Assess your performance by taking topic-wise and full length mock tests.
Explore More
Online tuitions for international compeitions like SASMO, SEAMO, etc for Grades 1-11.
Explore More